KLSE Top 3 Plantation Stocks You Must Know Before Investing & Why Investor/Traders must have these related stocks in their portfolio?
The plantation sector is off to a good start in 2020 as FCPO continues to extend its uptrend prices from 2019 to trade above RM3,100 per tonne on strong fundamentals.
We expected to last till the second quarter of 2020, supported by reducing FCPO inventories and declining stocks but more importantly the biodiesel usage B30/B20 respectively in Indonesia and Malaysia.
Malaysian’s Plantation sector is one of the biggest contributor to Malaysia’s GDP Growth. Responsible for providing 1/3 of employment to Malaysia worker, plantation stocks have seen volatility where back in Aug 2019 and now achieving almost 3 year high. Back in Aug 2019, TradeVSA make a forecast that at FCPO price @ RM 2,200, it was the lowest point before it began to rally to new high RM3,100. The reason for the bottoming of FCPO was a technical double bottom at support.
Let’s look into 3 good plantation stocks that has potentials. We look at the entire KLSE sectorial analysis to see why Plantation sector being the most dominant over other like technology and energy.
TradeVSA Sector Analysis

In our TradeVSA KLSE Sector screener, we can easily select top three counter doing fairly well from the technical aspects of Volume Spread Analysis (TradeVSA method). In addition, with our toolkit colour coded for ease of stock selection,(eg. Green with Purple cells is preferred), we have them “bubbled to the top” for quick investor/trader reference.
TradeVSA KLSE Sector Screener – Plantations

KLSE Sector Screener for Plantation shown currently lots of counters is in the uptrend and likely forming re-accumulation stage. In this article, we will focus Top 3 Plantation counters from the TradeVSA screener above.
1. Rimbunan Sawit
2. Jaya Tiasa
3. TDM Bhd
Rimbunan Sawit (5113.KL)
Background
Listed in June 2006, Rimbunan Sawit is principally an investment holding company while its subsidiaries are involved in the cultivation of oil palm, processing of palm oil and other ancillary activities.
RSawit has embarked on an acquisition trail to expand its plantation landbank, particularly in Sarawak since 2008. RSawit acquired 85% equity interest in two companies, Baram Trading and Nescaya Palma, which owned in total 6,911 ha of plantation land in Sarawak, out of which 4,947 ha were already planted with oil palm. Following the completion of the acquisitions in March 2008, Rsawit’s plantation landbank was increased to 20,574 ha. In December 2009, RSawit acquired of two companies (Lumiera Enterprise and Woodijaya) located in Miri Division, Sarawak. The acquisitions thus increased R Sawit’s total plantation landbank to 31,645 ha.
In September 2010, RSawit acquired equity interests (varying between 60% to 100%) in 9 plantation companies and the commercial rights of a plantation estate (Simunjan). Following these acquisitions, the group owned 91,500 ha of plantation landbank in Sarawak; out of which about 39,560 ha were planted, 38,000 ha were unplanted and to be developed later, and the balance 13,940 ha were unplantable and/or to be used for other purposes.
However, at the end of 2011, the group acquired oil palm planted land in Niah, Sarawak; and this was followed by the acquisition of another land in the Melinau Area in Sarawak in November 2012. This has thus lifted its plantation landbank to 92,312 ha.
Known Major Shareholder(s) (As at 1st Apr 2019)
56.90 % Tan Sri Datuk Sir Diong Hiew King*
5.36 % State Financial Secretary
* Direct & indirect interest
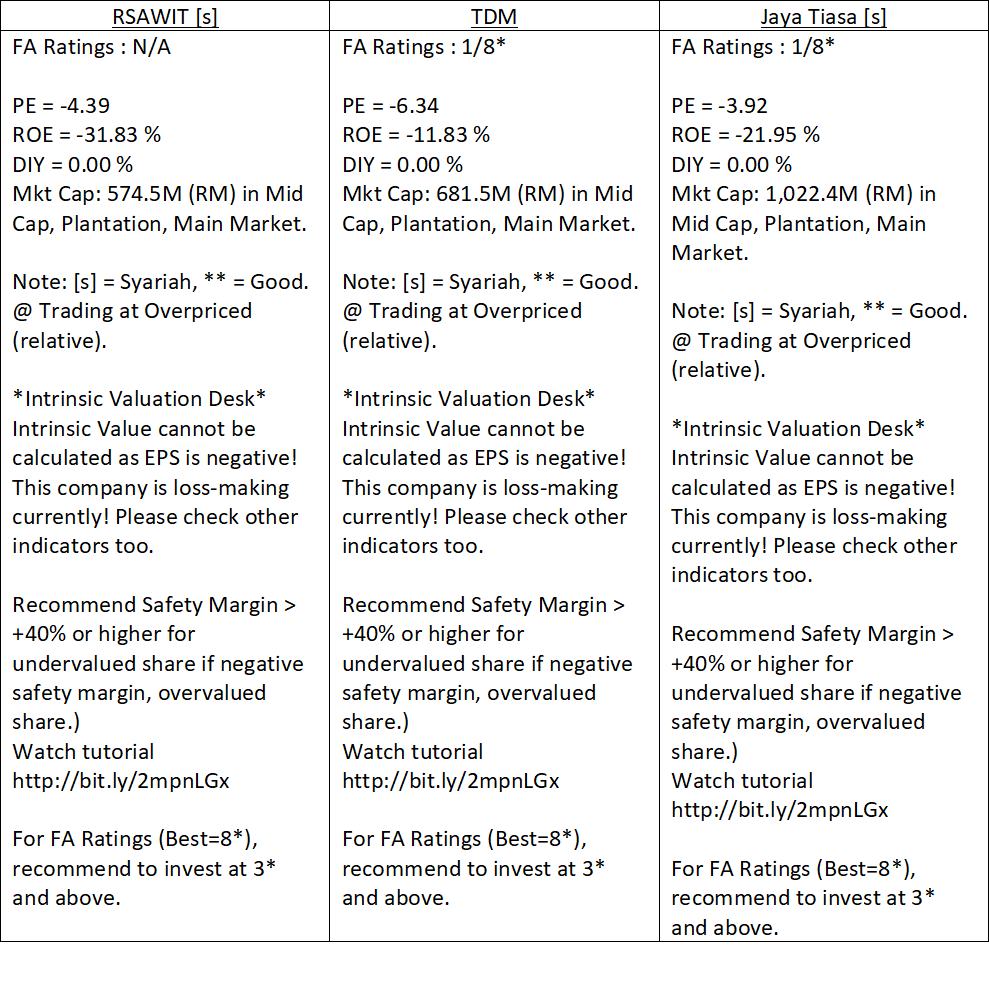
A Quick Fundamental View for Rimbunan Sawit:
Fundamental for RSAWIT[s] (5113).
FA Ratings : N/A
1. PE = -4.12
2. ROE = -31.83 %
3. DIY = 0.00 %
4. Mkt Cap: 539.0M (RM) in Mid Cap, Plantation, Main Market.
Note: [s] = Syariah, ** = Good.
@ Trading at Overpriced (relative).
*Intrinsic Valuation Desk*
Intrinsic Value cannot be calculated as EPS is negative! This company is loss-making currently! Please check other indicators too.
Profitability Analysis

TradeVSA Weekly & Daily Chart

Weekly TradeVSA chart show a strong breakout with high volume. The last shakeout happened in the accumulation before Smart Money pushes the price above resistance. Notice the green pentagon in Mid of November show a great interest by Smart Money to at support level. Currently price is pulling back after we spotted the Up-Thrust bar with high volume. Looks for the next Sign of Strength bar to look for potential entry.

A huge pullback happened after the mark-up stage since end of October. Notice price reverse with No Supply (NS) signal show Smart Money is flushing out weakhand holders. Pullback completed with NS signal and mark-up stage will continue.
Another red pentagon appeared in the Mark-Up stage which likely to form a pullback pattern. You can trade with the next green pentagon bar / signal similar on 16 December 2019.
Jaya Tiasa (4383.KL)
Background
Formerly known as Berjaya Textiles, the company became known as Jaya Tiasa in March. Jaya Tiasa through its subsidiaries, is engaged in the development of oil palm plantations and related activities. The Company’s segments are Logs Trading, Manufacturing, Oil Palm and Others. The Logs Trading segment is engaged in extraction and sales of logs and development of planted forests. The Manufacturing segment is engaged in manufacturing and trading of sawn timber, plywood, veneer, blockboard and laminated wood. The Oil Palm segment is engaged in the development of oil palm plantations and its related activities. The Others segment is engaged in the provision of air transportation services and investment holding. It manufactures a range of products, including Round Logs, Sawntimber and Film overlay plywood. Jaya Tiasa exports its processed wood products to various markets, including Asia Pacific, Middle East, Europe and Latin America.
Known Major Shareholder(s) (As at 30th Sep 2019)
30.18 % Tan Sri Datuk Sir Tiong Hiew King*
9.41 % Genine Chain Ltd
5.21 % Amanas Sdn Bhd
* Direct and Indirect.
A Quick Fundamental View for Jaya Tiasa:
Fundamental for JTIASA[s] (4383).
FA Ratings : 1/8*
1. PE = -3.88
2. ROE = -21.95 %
3. DIY = 0.00 %
4. Mkt Cap: 1,012.7M (RM) in Mid Cap, Plantation, Main Market.
Note: [s] = Syariah, ** = Good.
@ Trading at Overpriced (relative).
*Intrinsic Valuation Desk*
Intrinsic Value cannot be calculated as EPS is negative! This company is loss-making currently! Please check other indicators too.
Profitability Analysis
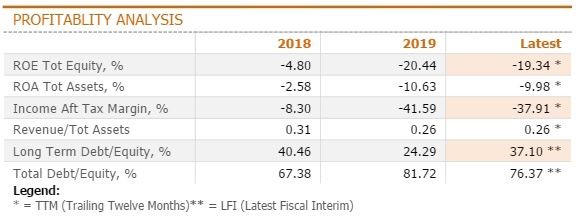
TradeVSA Weekly & Daily Chart

Weekly TradeVSA chart for Jaya Tiasa show the exact similar setup with Rimbunan Sawit. Green bullish pentagon signal in Mid of September 2019 indicate support and interest by Smart Money after the Spring bar at support level. Price subsequently mark-up with high volume.
A similar Up-Thrust bar appeared like Rimbunan Sawit and subsequently price trying to test with narrow spread bar to support. We will look for potential strength to ensure the pullback pattern is form before looking for entry.
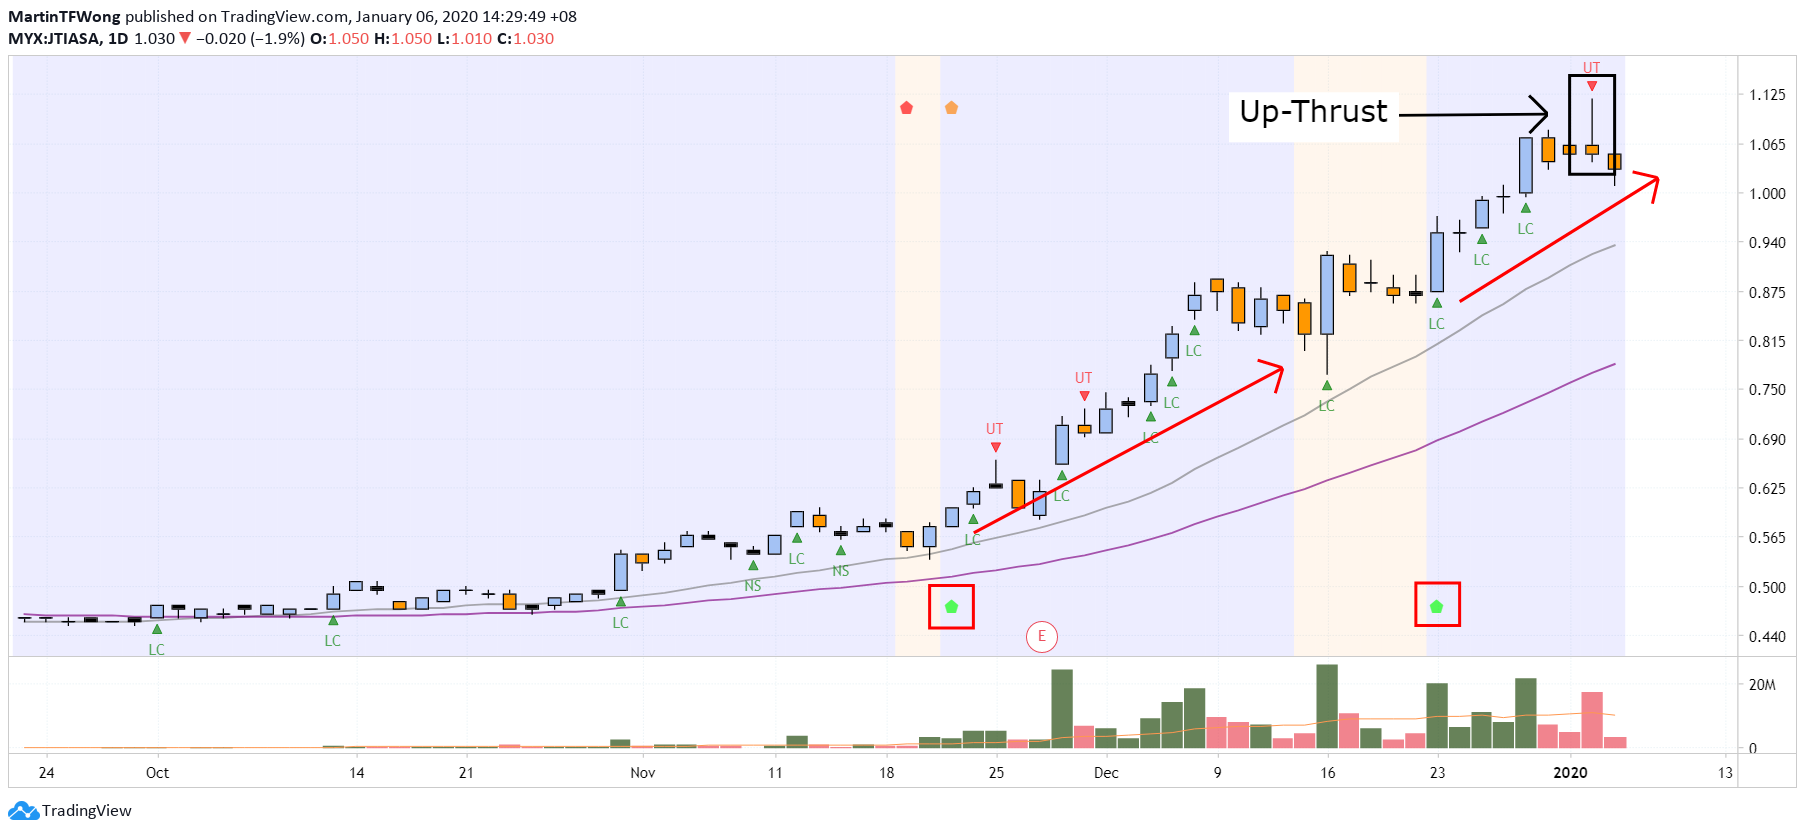
Clearer signal can be spotted in the daily chart with the help of Pentagon signal. Price moving up from accumulation stage and increase with volume. Pullback have completed with another Green Pentagon bar.
Notice Up-Thrust bar with high volume appeared too in daily chart indicate potential pullback is coming.
TDM Bhd (2054.KL)
TDM is currently engaged in two core activities – oil palm plantations and healthcare.
The Plantation segment involves activities, such as cultivation of oil palms, sale of fresh fruit bunches and management of plantation operation services. The Healthcare segment involves activities, such as provision of healthcare consultancy and specialist medical center services. Its segments operate in approximately two geographical areas, including Malaysia and Indonesia. In Malaysia, it has operations in investment holding, cultivation of oil palms, trading of palm oil and other related products and provision of healthcare services. Other operations include provision of management services. Its operations in Indonesia are cultivation of oil palms, trading of palm oil and other related products. Its subsidiaries include TDM Plantation Sdn. Bhd. and TDM Capital Sdn. Bhd.
Known Major Shareholder(s) (As at 11th Apr 2019)
61.49 % Terengganu Incorporated Sdn Bhd
A Quick Fundamental View for TDM Bhd:
Fundamental for TDM (2054).
FA Ratings : 1/8*
1. PE = -6.57
2. ROE = -11.83 %
3. DIY = 0.00 %
4. Mkt Cap: 706.7M (RM) in Mid Cap, Plantation, Main Market.
Note: [s] = Syariah, ** = Good.
@ Trading at Overpriced (relative).
*Intrinsic Valuation Desk*
Intrinsic Value cannot be calculated as EPS is negative! This company is loss-making currently! Please check other indicators too.
Profitability Analysis
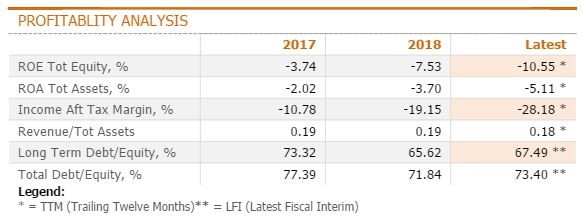
TradeVSA Weekly & Daily Chart
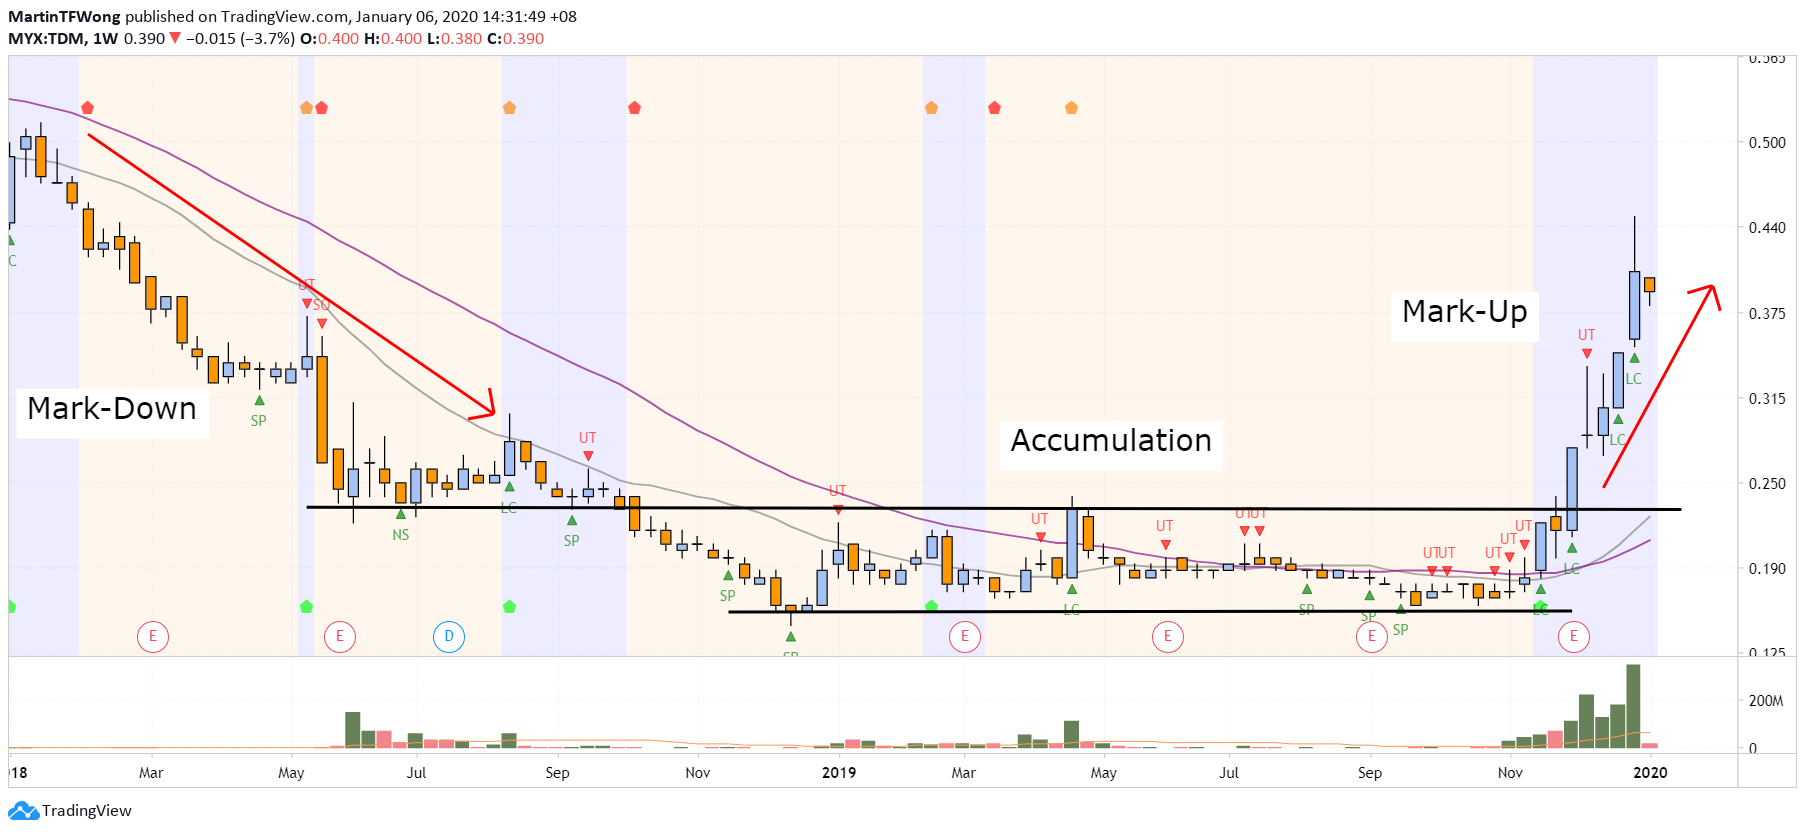
TDM currently is in Mark-Up stage after the Green Pentagon signal appeared on mid of November 2019. The chart movement is similar with RSawit and JTiasa which we saw a period of accumulation before break out with high volume.

Clear signals can be easier spotted too in daily TradeVSA chart for TDM. Notice in the chart, we have 2 pullback areas for potential low risk entry in the Mark-up stage. Volume increases too with Line Change indicate Smart Money are interested to mark-up higher.
The current chart pattern is forming another pullback again after the Up-Thrust bar.
Summary
After considering all the fundamental and technical aspect, we preferred JayaTiasa over TDM & RSawit. From Fundamental standpoint, there are not much difference, still losing money from last financial year.
We will cover for technology sector next week. Let us know what sector you wish us to cover in the next article in the comment below.
Contact us via: email at support@tradevsa.com or Call/WhatsApp at +6010 266 9761 if you have any queries.
Join our FREE Education via Telegram Channel: https://t.me/tradevsatradingideas
Facebook: www.facebook.com/MartinTFWong
Youtube: https://www.youtube.com/channel/UCKiafbxoa-DtTF5YP0v-HYg
Follow in the Telegram, Facebook and Youtube for daily update


