Licensed by Securities Commission Malaysia
TradeVSA System Sdn Bhd is a Capital Markets Services License (License No.: eCMSL/A0402/2024) for the regulated activity of Investment Advice (“IA”) in relation to Digital Investment Advice (“DIA”) and is regulated by the Securities Commission Malaysia (SC).
How to Use SMARTRobie®?
Get started with these simple steps. Watch the short tutorial video now.
SMARTRobie® Tutorial:
- SMARTRobie® Quick Guide:
https://youtu.be/py_URHHp1LY - Chinese Version:
https://youtu.be/AE3kI2xWqXs - Petunjuk Penggunaan SMARTRobie®:
https://youtu.be/ihoE51HqBiY
User Feedback
*For SMARTRobie® user feedback, click below:
https://tradevsa.com/feedback/
Declaration By Users
*SMARTRobie® user must declare his own Investor category before using the trading ideas on SMARTRobie®. The self-declaration places on the responsibility of truthfulness upon the user.
TradeVSA takes all the necessary care and due diligent to design system to cater for different Risk Profile of our users. The following trading ideas is designed for the respective investor’s profile:
|
Risk Profile |
Definition |
Trade Ideas |
|---|---|---|
|
Beginner |
|
Pentagon Guider®, Robie FA Collection |
|
Intermediate |
|
Pentagon Guider®, Robie FA Collection, Trending Stock, Hot Sector |
|
Advanced |
|
Pentagon Guider®, Robie FA Collection, Trending Stock, Hot Sector, Premium Intraday |
- Knowledge: Limited understanding of financial markets and investment products and strategies
- Experience: Little to no hands-on experience on trading/investing
- Risk Tolerance: Low-to-Moderate and not comfortable with market fluctuations.
- Knowledge: Solid understanding of financial markets and investment products and basic trading strategies
- Experience: Moderate amount of hands-on experience on trading/investing
- Risk Tolerance: Moderate and willing to take calculated risk based on facts, backtesting research and analysis.
- Knowledge: In-depth knowledge of financial markets and investment products and advanced trading strategies
- Experience: Lot of hands-on experience on trading/investing
- Risk Tolerance: High, comfortable with taking risks in pursuit of higher reward.
*TradeVSA shall not be held responsible to any person for any false declarations made by the user.
SMARTRobie® gives Fresh Trading Ideas Every 20 minutes for Traders.
SMARTRobie® Premium Intraday lists refresh every 20 minutes, powered by TradeVSA Pentagon Guider® System with a clear Up signal (Green Pentagon) or Down signal (Red Pentagon) on TradeVSA chart.
Are your stock trade ideas from SMARTRobie® guaranteed?
There are winners and losses in trading stock. Past performance from SMARTRobie® is not an indicator of future performance. There are risks involved in trading shares. Please have proper risk management when trading shares as a loss of money is highly probable.
What SMARTRobie® stock market assistant does:
-
1. Provides live stock price for [Bursa Stock name] and other exchanges:
eg. Public Bank is PBBANK. We cover all the stocks excluding warrants, and loans stock.
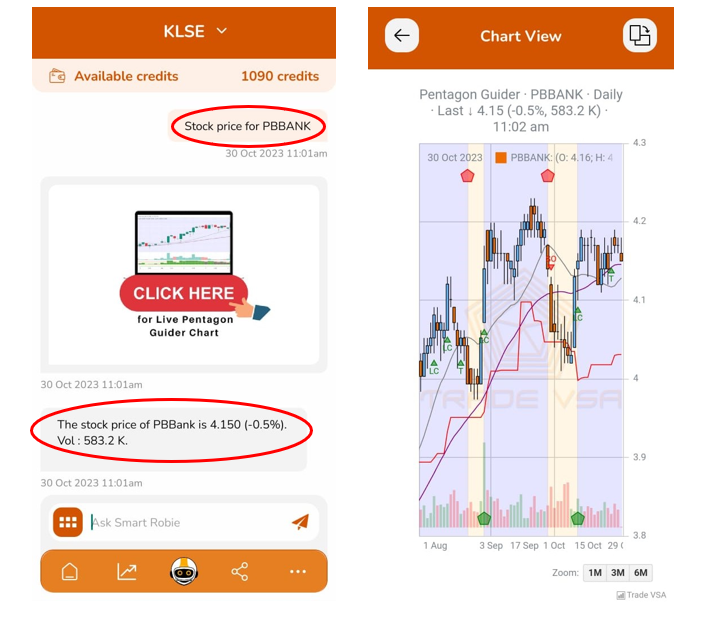
*Note: Last price displayed is End of Day (EOD) previous closing unless it is Premium Intraday which the price is 15-20 mins delayed.
-
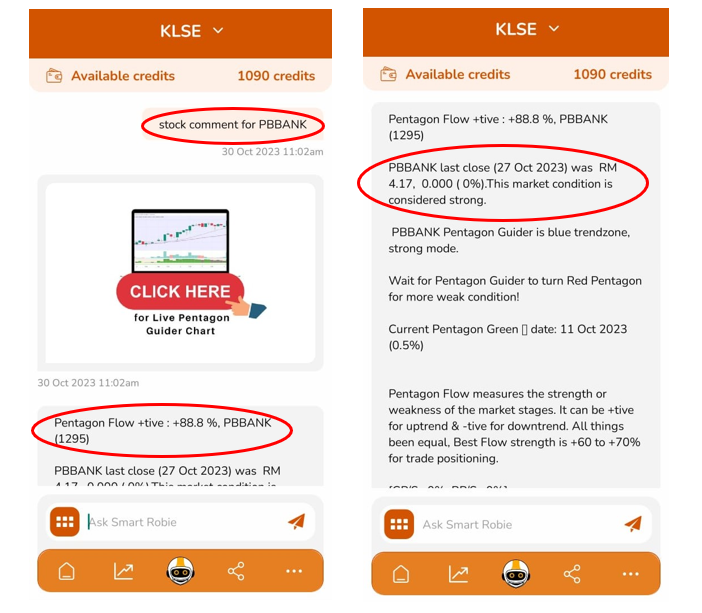
2. Provide Stock Comment for Stocks:
SMARTRobie® gives a bullish and bearish technical rating according to Pentagon Guider® System.
-
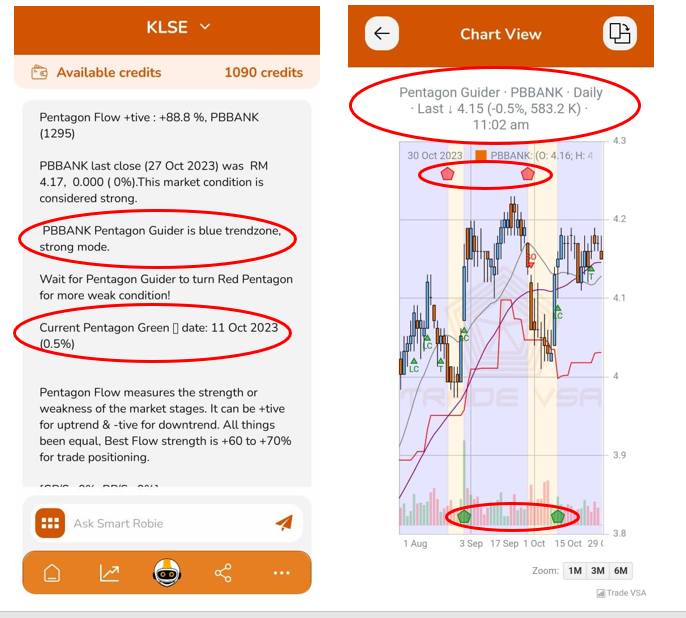
3. Display Stock Chart for Individual Stock:
SMARTRobie® is powered by Pentagon Guider® System displaying a daily chart for individual stock with a clear Up signal (Green Pentagon) or Down signal (Red Pentagon) on TradeVSA chart.
-
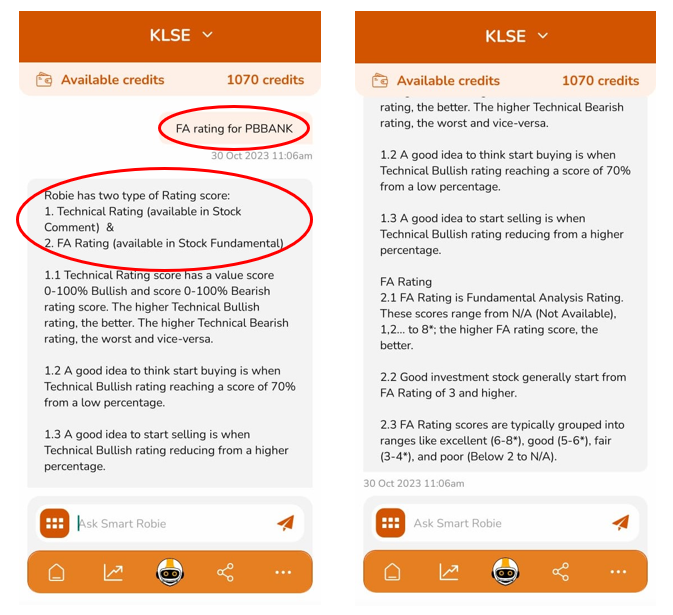
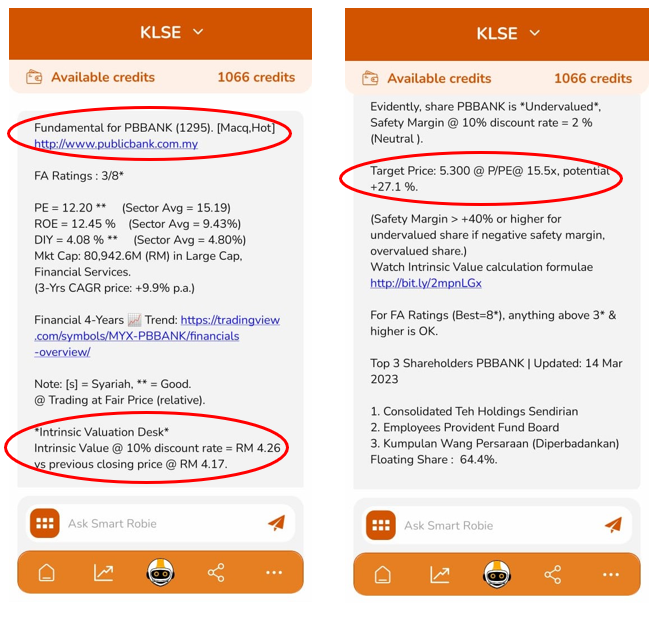
4. Display simple fundamental data for individual stock and provide SMARTRobie® FA ratings:
FA ratings greater than 4* or higher are good FA stocks.
-
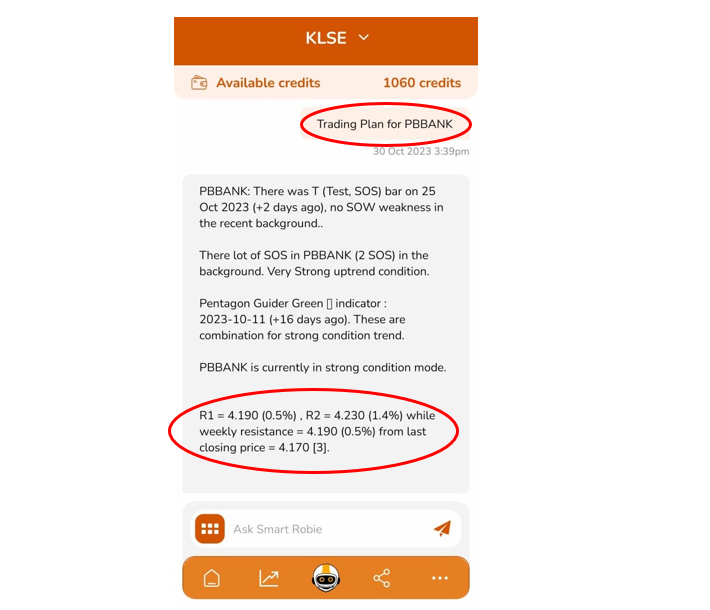
5. Display daily trading plan for individual stock:
Shows daily trading plan for a stock with possible support, S1 & S2 and likely resistance R1 & R2 and ATR SL (Average True Range) stop loss.
-
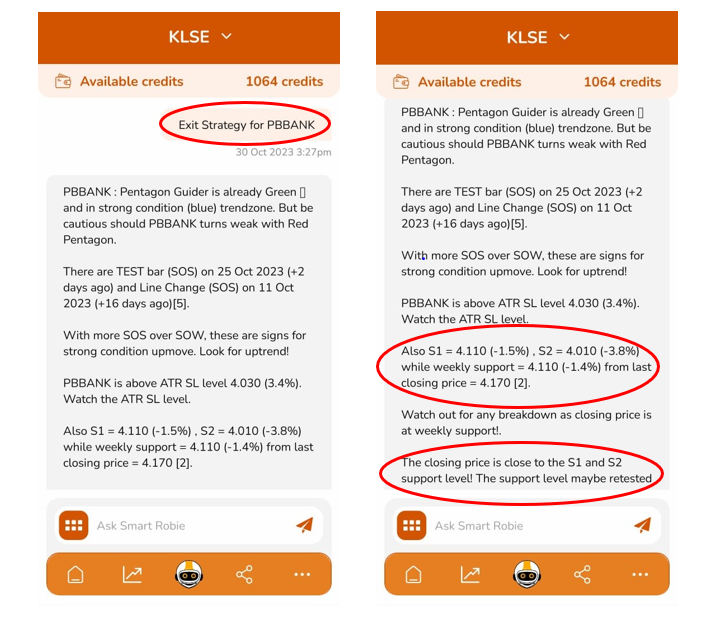
6. Show Exit strategies for individual stock:
-
7. Provide intrinsic value calculation for share:
Look for Stock Fundamental Menu in Stock Menu “Stock Fundamental for PBBANK”.
-
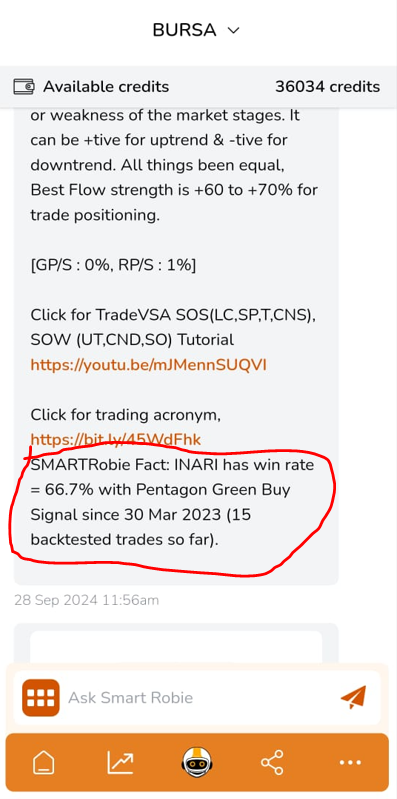
8. Provide automated backtested trades win rate for your favourite stock:
Calculates the percentage of trades for a specific stock with a price gain greater than +4.5% from the Green Pentagon signal's closing price, based on backtested results over the last 18 months.
-
9. Is SMARTRobie watchlist alert real time for Pentagon Guider changes and price alert?
The Pentagon Guider watchlist updates end of day after markets close, while Pentagon Guider chart refreshes every 15-20 minutes (price delayed). Price alert is also delayed 15-20 minutes and alert within the same period.
-
10. What are the current SMARTRobie monthly win rates for Pentagon Guider Stock Trade Ideas?
These percentages represent the proportion of trades that ended profitably each month, offering a snapshot of the system’s performance over the current calendar year.
Malaysia: https://smartrobie.com/backtest-results/
US: https://smartrobie.com/backtest-results/?exchange=US
What are those symbols on the SMARTRobie® Pentagon Guider® charts?
SMARTRobie® chart contains VSA symbols, lines and Technical indicators used as follow:
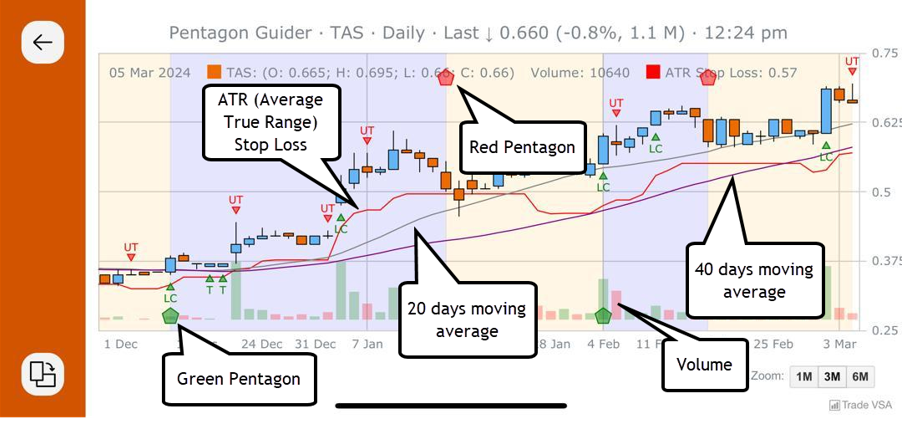
Symbol or Labels displayed on TradeVSA chart follows this.
Green Pentagon  => Buy signal
Red Pentagon  => Sell Signal
 Sign of Strength - SoS (Bullish)
CNS = confirmed no supply
LC = Line change
SP = Spring
T = Test
SoS = Sign of Strength, bullish signal conditions where demand exceed supply
 Sign of Weakness - SoW (Bearish)
CND = confirmed no demand
SO = Sell Off
UT = upthrust
SoW = Sign of Weakness, bearish signal conditions where supply exceed demand
Pentagon Guider® technical details associated with each stock namely.
- Pentagon Flow (measuring strength or weakness) and
- Pentagon Date with (price changes since Pentagon +/- %)
These acronyms are explained here: https://tradevsa.com/glossary
🎞️ Watch this video for more details:
Pentagon Guider® Sign of Strength (SOS) and Sign of Weakness (SOW) short tutorial (9min):
https://youtu.be/mJMennSUQVIFull Video: U.S Share Analysis Technique with SMARTRobie®:
https://youtu.be/yXLLkElqodcStock Trade Idea Disclosures:
📈 Methodology: Technical Analysis of Volume Spread Analysis. Volume Spread Analysis (VSA) is a form of technical analysis that attempts to look into price action in relation to volume. VSA is the study of the market forces of supply and demand and the manipulation of those forces through the psychology of crowd behavior.
🎯 Stock Target Profit (TP) Revision Policy is revised daily: Changes of the TP stocks are based on the previous high or price resistance at peak levels usually at 1 month-high, 3 months high, 1 week high. Eg. if there is a change in 1-week high overnight, TP will be revised to this new price.
Stock price and volume are updated during the trading day but the TP is updated after market closes.
- R1 = resistance 1 refer to the shortest timeframe TP at 1 week high or 1 mth high whichever higher price.
- R2 = resistance 2 refer to the longer timeframe RP at 1 mth high or 3 mth high whichever higher price.
- S1 = support 1 refer to the shortest timeframe Cut Loss (CL) level at 1 week low or 1 mth low whichever lower price.
- S2 = support 2 refer to the longer timeframe Cut Loss (CL) level at 1 mth low or 3 mth low whichever lower price.
Buy Call Rating
The Buy Call Rating in SMARTRobie® combines technical setup and Fundamental Rating to calculate a star rating (0 to 5 stars). A higher star rating indicates a stronger buy signal, while a lower rating suggests weaker confidence. It helps traders assess stocks based on both technical trends and fundamental strength for better decisions.
Limitation of Algorithm
- Reduced Effectiveness in Trendless Individual stock chart and overall Index Stock Markets: Without clear trends, it will affect the responsiveness of the Pentagon Guider® System in plotting the RED and GREEN Pentagon indicators.
- Increased Signal Noise: Increased noise/randomness in daily or weekly timeframes complicates analysis in trendless conditions.
- Stock charts that have Insufficient Volume: Example, trading with continuous bar of zero volume will give raise to inaccurate Pentagon Guider® System indicators.
- Stock charts with less than 6 months period of trading bars - provide insufficient data for Pentagon Guider® System Algorithm to compute/calculate.
- SMARTRobie also employs sentiment analysis for news headlines to enhance decision-making, making it more robust and relevant for users.
Risk inherent in the use of technology algorithms.
- Stock Market Adaptability Risk: Pentagon Guider® System will have limitation to adapt quickly to sudden, non-trend-based stock market movements, which could lead to potential losses.
Past Performance Pentagon Guider® System Guide (Backtesting over 5 years)
Image below is a snapshot of the backtesting table results over the past 5 years, trading a virtual account with RM50,000. The strategy involved buying stocks after a Green Pentagon signal and exiting either at a specific profit target, the end of the period, or when a Red Pentagon appeared or cut loss level.
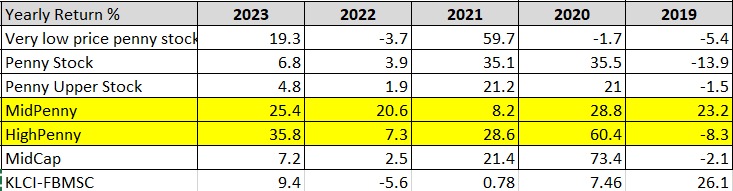
*Past performance is no indicator for future results. There are risks in trading shares.
Win Rate Calculation Method
Calculates the percentage of trades for a specific stock with a price gain greater than +4.5% from the Green Pentagon signal's closing price, based on backtested results over the last 18 months.
Hot Sector Tab Menu
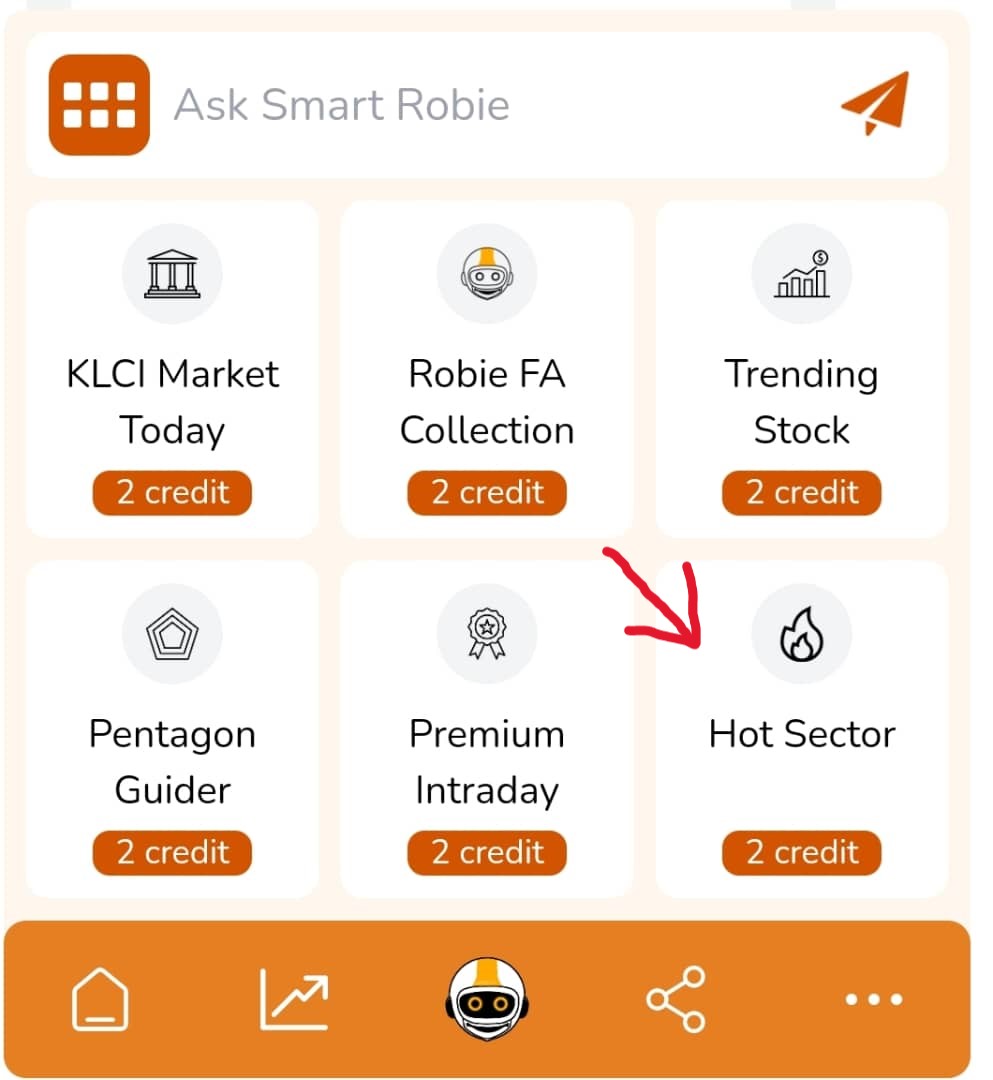
The Hot Sector for each exchange is calculated using Relative Strength comparison to the benchmark of the exchange indice eg. Bursa-KLCI for Bursa Malaysia exchange and so for.
The strongest trend for the sector will be listed in priority from No. 1 to No. 5 sector will only be listed accordingly.
Under each sector label, example
*Note: All these been equal, choose to trade/research those stocks with Green Pentagon and avoid the Red Pentagon in the respective sector listing within Hot Sectors.
👍 See Happy users’ testimonial:
https://tradevsa.com/facebook-reviews/
Follow us at SMARTRobie® FB Page and weekly Live FB SMARTRobie® session:
https://fb.com/SMARTRobie
Disclaimer:
Past performance is not an indicator of future performance. There are risks involved in buying and selling shares. Please have proper risk management when trading shares as a loss of money is highly probable.
Click below for SMARTRobie® Terms & Conditions: SMARTRobie® Terms & Conditions