Visit http://tradevsa.com/tradevsa-pentagon-guider/ for details on SMARTRobie Pentagon Guider System works.
Tutorial Link here: https://youtu.be/py_URHHp1LY
SMARTRobie stock alert lists refreshes every 20 minutes, powered by TradeVSA Pentagon Guider System with Up & Down signal indicator.
There are winners and losses in trading stock. Past performance from SMARTRobie is not an indicator to future performance. There are risks involved in trading shares. Please have proper risk management when trading shares as loss of money is highly probable.
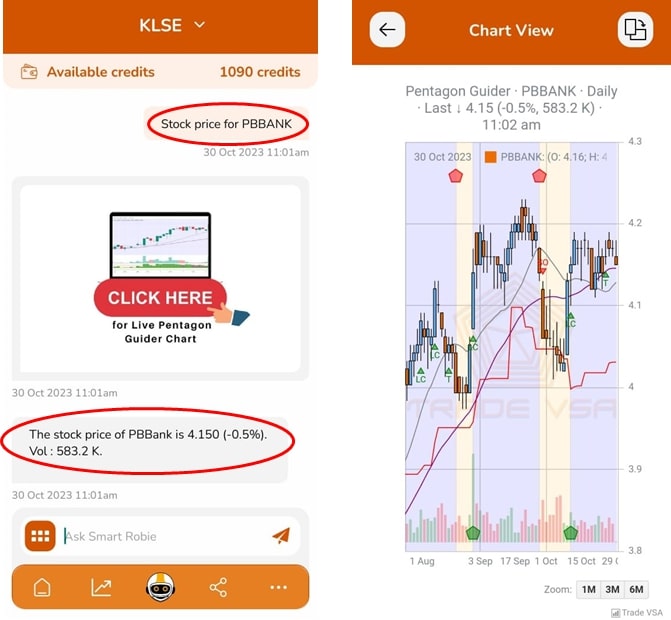
4.1. What is the live stock price for [Bursa Stock name] and other exchanges? eg. Public Bank is PBBANK. We cover all the stocks excluding warrants, and loans stock.
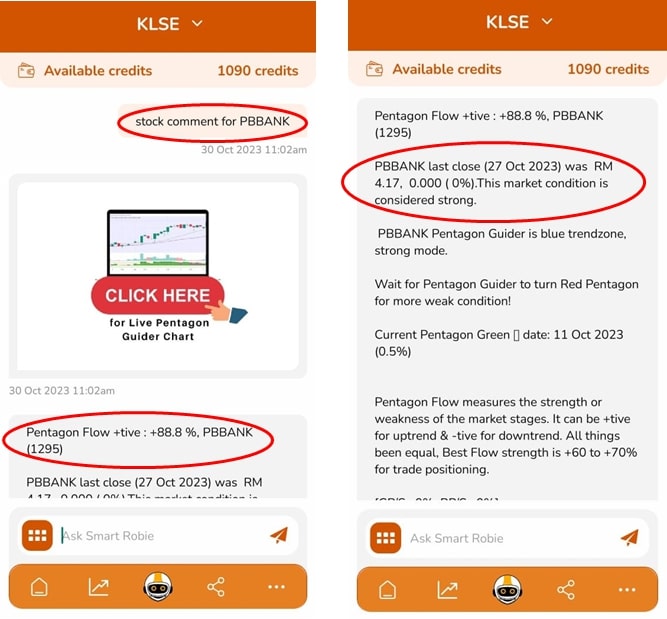
4.2. What is the Stock Comment for PBBANK today? SMARTRobie gives a bullish and bearish technical rating according to Pentagon Guider System.
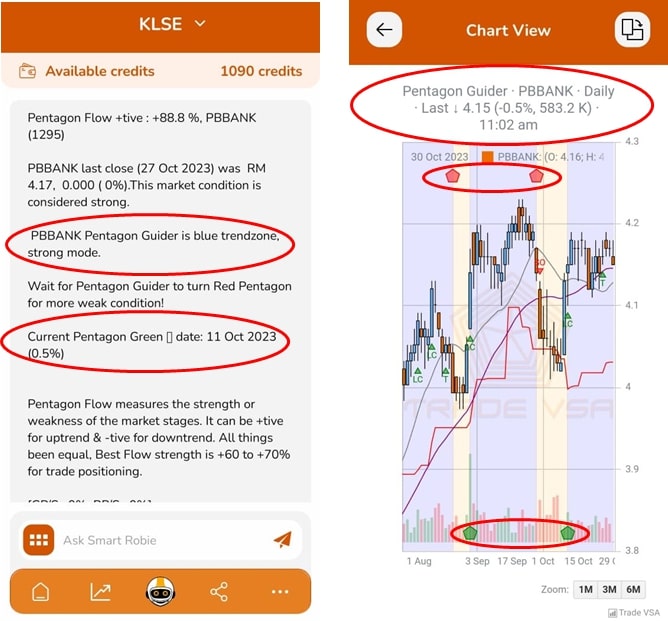
4.3. Stock Chart for PBBANK: SMARTRobie is powered by Pentagon Guider System displaying daily chart for individual stock with clear Up signal (Green Pentagon) or Down signal (Red Pentagon) on TradeVSA chart.
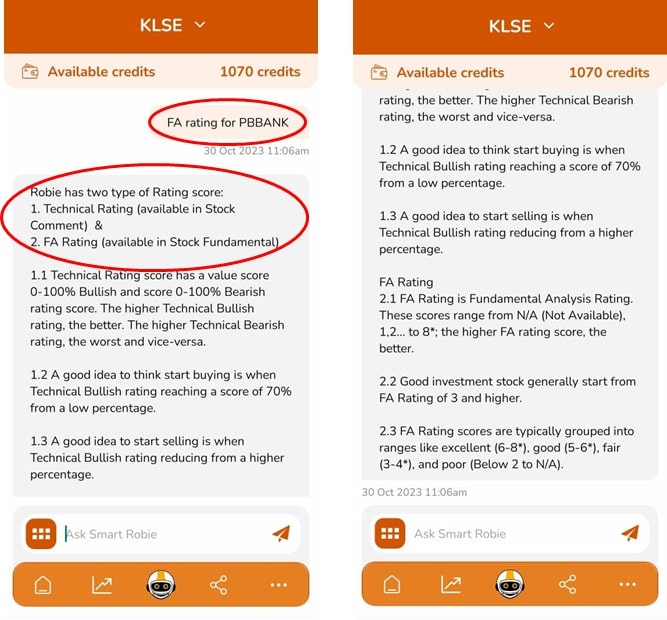
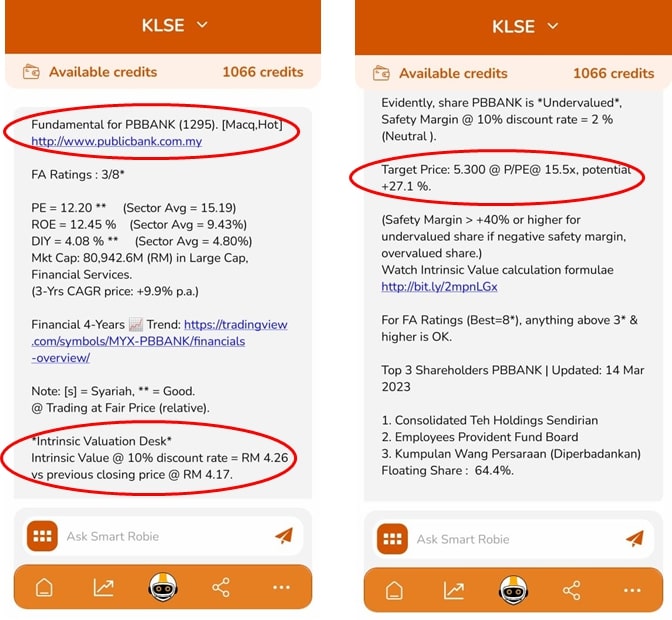
4.4. Displays simple fundamental data for individual stock and provide SMARTRobie FA ratings. FA ratings greater than 4* or higher is good FA stocks.
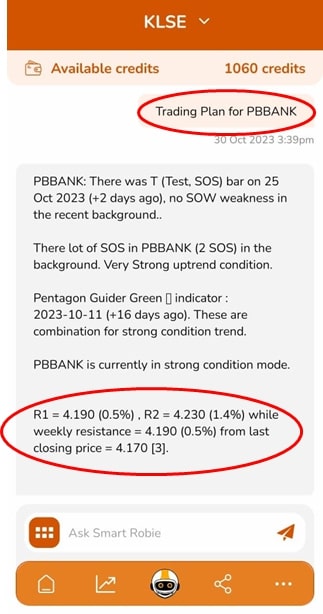
4.5. Displays daily trading plan for individual stock with possible support, S1 & S2 and likely resistance R1 & R2 and ATR SL (average true range) stop loss.
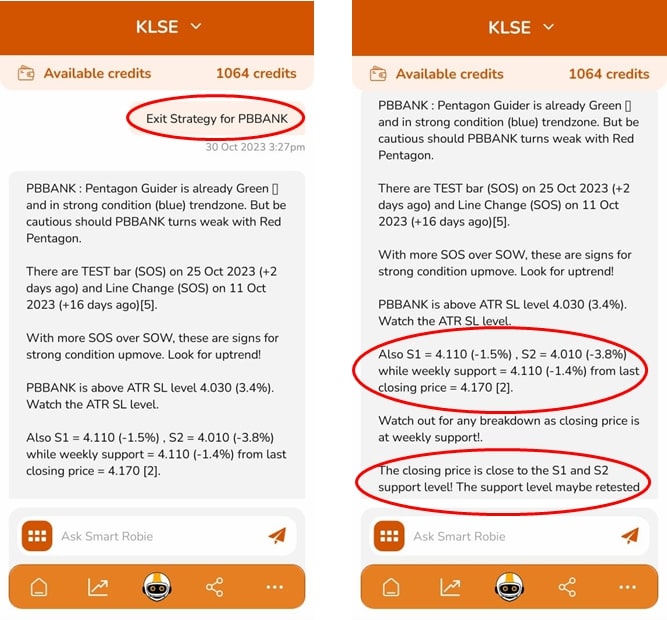
4.6. Shows Exit strategies for individual stock and volume spread analysis on specific stock.
4.7. Provide intrinsic value calculation for share. Look for Stock Fundamental Menu in Stock Menu “Stock Fundamental for PBBANK”.
SMARTRobie chart contains VSA symbols (volume spread analysis methodology) eg. UT, SO and SP, LC are sign of weakness (SoW) and sign of strength (SoS) respectively, indicating readiness of the market to move lower o higher too.
Watch this video for more details:
https://youtu.be/mJMennSUQVI(short video)
https://youtu.be/yXLLkElqodc (SMARTRobie for US Market)
Click this url to learn more: https://bit.ly/45WdFhk
Methodology: Technical Analysis of Volume Spread Analysis. Volume Spread Analysis (VSA) is a form of technical analysis which attempts to look into price action in relation to volume.
VSA is the study of the market forces of supply and demand and the manipulation of those forces through the psychology of crowd behaviour. VSA is created by co-founder Guru, Mr. Tom Williams experience and discoveries applied to understand the underlying mechanics of the markets and trade them accordingly.- Stock Target Profit (TP) Revision Policy is revised daily: Its changes of the TP stocks are based on previous high or price resistance at peak levels usually at 1 month-high, 3 months high, 1 week high. Eg. if there is a change in 1-week high overnight, TP will be revised to this new price.
Stock price and volume are updated during trading day but the TP is updated after market closes.- R1 = resistance 1 refer to the shortest timeframe TP at 1 week high or 1 mth high whichever higher price.
- R2 = resistance 2 refer to the longer timeframe RP at 1 mth high or 3 mth high whichever higher price.
- Symbol or Labels displayed on TradeVSA chart follows this.
- Green Pentagon => Buy signal
- Red Pentagon => Sell Signal
- Sign of Strength, SOS (Bullish)
- CNS = confirmed no supply
- LC = Line change
- SP = Spring
- T = Test
- Sign of Weakness, SOW (Bearish)
- CND = confirmed no demand
- SO = Sell Off
- UT = upthrust
These acronyms are explained here: https://tradevsa.com/glossary
Google Review of 4.8* by our 400+ users: https://bit.ly/49bIHUB
Submit your google review here: https://bit.ly/3sfVDDW
1. Every Monday and Friday, 10:15 am
Weekly Live FB training and tutorial and market update: https://fb.com/SMARTRobie
2. Our website: https://tradevsa.com
3. Hit and Subscribe to our Youtube Channel! https://youtube.com/tradevsa
4. Join our +6k users Telegram Channel! https://t.me/tradevsatradingideas
5. Contact us via Whatsapp https://wa.me/60102669761
Past performance is not an indicator to future performance. There are risks involved in buying and selling shares. Please have a proper risk management when trading shares as loss of money is highly probable.
